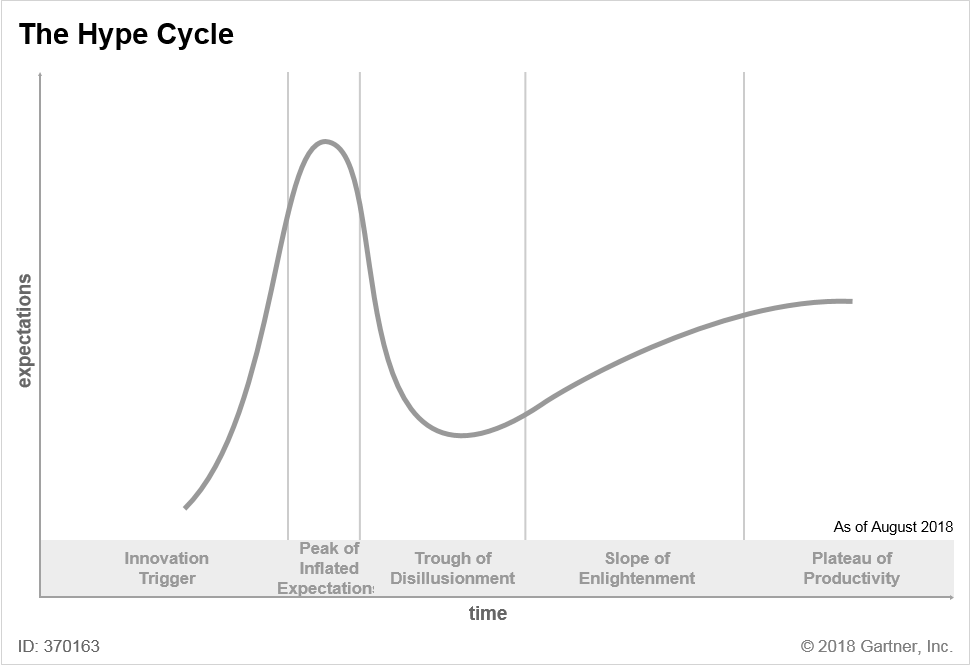
The Gartner Hype Cycle is a purported graph of how technologies gain acceptance:
Stuff starts at an “Innovation Trigger.” Then it zooms up, to a “Peak of Inflated Expectation(s)” … then, oh no, it crashes into a “Trough of Disillusionment”! Then it slowly recovers — up the “Slope of Enlightenment,” to the “Plateau of Productivity.” Hooray!
The Hype Cycle graph is common in Bitcoin and blockchain advocacy — particularly as an excuse for failure. It’s regularly trotted out as evidence that this is just a seasonal dip, we’re actually on the Slope of Enlightenment, and a slow progression to the moon is inevitable!
A common example of Hype Cycle-like thinking is the perennial wrong and inane comparison between Bitcoin and the Internet — a comparison which you’ll only ever hear as an excuse for Bitcoin’s failure in the wider market.
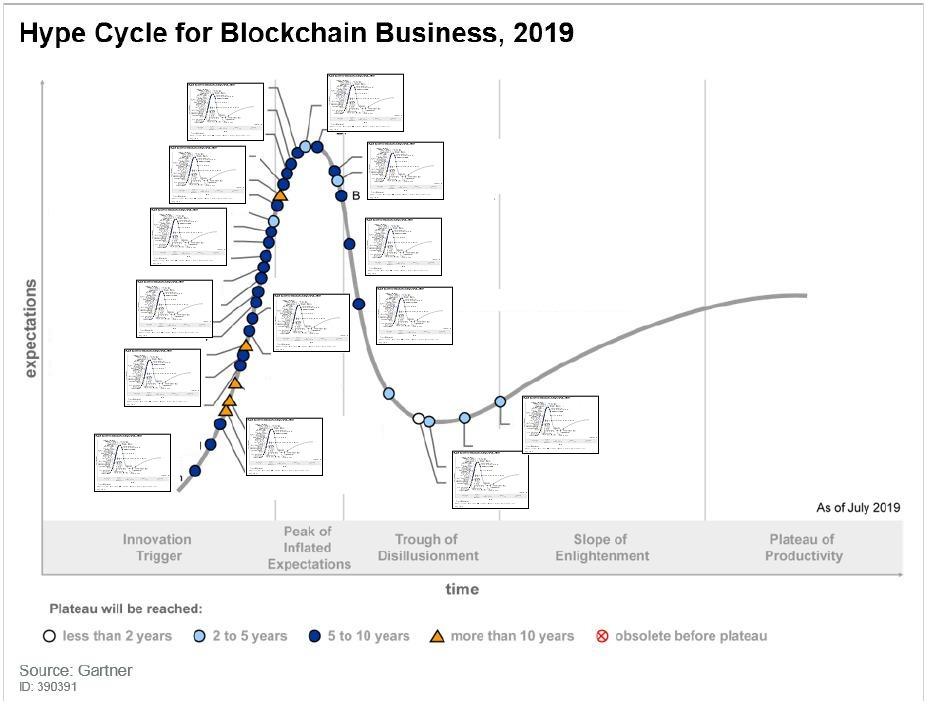
Gartner themselves put out a Hype Cycle press release for “blockchain” in 2019:
Why the Hype Cycle is misleading
The Hype Cycle presumes technologies generally recover from the hype phase, work out well, and go forward to success. And this just isn’t true — sometimes they just fail. Most new technologies go nowhere.
This makes the Hype Cycle particularly silly to invoke right at the trough — because that’s literally the moment when you don’t have evidence your favourite thing has any substance, and will recover.
Origins
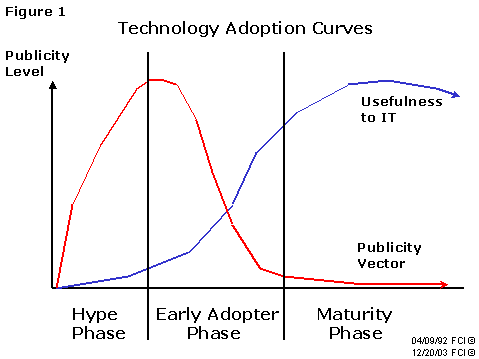
The Hype Cycle graph and the name were derived from an excellent 1992 article in Enterprise Systems Journal, “The Sociology of Technology Adaptation” by Howard Fosdick — and Fosdick’s observation, with a graph, that publicity for a technological innovation peaks well before it’s useful to the IT department.
This article describes what I do in my day job as a system administrator — “Spotting technology trends, knowing which will flourish, which will fail, and ultimately, which are applicable to one’s IS department are critical to IS success.”
Fosdick says:
A technology that has passed the “hype phase” of figure 1 and entered the “early adaptors phase,” will have some adherents who can point to their real-world experience and say “it works, because it worked for us.”
… Only technologies with a future will have the “growth paths” that all vendors promise.
What Fosdick doesn’t do there is presume that technologies will follow this path.
Fosdick correctly identifies what you need before you can claim your technology will go on to be useful — point at the production use cases that couldn’t have happened without it.
Gartner analyst Jackie Fenn adapted Fosdick’s graph, and the phrase “hype phase,” for her 1995 report “When to Leap on the Hype Cycle.”
Gartner realised the Hype Cycle was an eye-catching story, that got people interested — and they used it a lot through the late 1990s and early 2000s. Fenn and Mark Raskino expanded the idea into a book in 2008, Mastering the Hype Cycle: How to Choose the Right Innovation at the Right Time (US, UK).
Fosdick was delighted that his idea took off — “Silicon valley venture capitalists employ it in evaluating and marketing technology. Groups as far away as the Tasmanian and Russian governments have used it for managing technological change.”
Problems with the Hype Cycle
Advocates of failed technologies grasp at the Hype Cycle because it tells them their success is inevitable. It’s just science!
The problem is that the Hype Cycle isn’t science. Gartner present the Hype Cycle as if it’s a well-established natural law — and it just isn’t.
The Gartner Hype Cycle is not based on empirical studies — and in particular, it doesn’t account for technologies that don’t follow its cycle. Fosdick just wrote a passing article in a small-circulation magazine, and he admits his observation isn’t quantified.
Fosdick wants to tell you how to distinguish technologies that will fail from technologies that have a chance of not failing. Gartner’s graph is Fosdick’s article with a concussion.
If you look at Gartner’s versions of the graph from different years … you’ll see that some technologies just vanish from later editions, to be magically replaced by others — e.g., “Smartphone” showed up on the “Slope of Enlightenment” in 2006 without ever, apparently, having gone through a “Peak of Inflated Expectations.”
“8 Lessons from 20 Years of Hype Cycles” (archive) by Michael Mullany asks: “Has anyone gone back and done a retrospective of Gartner Hype Cycles?”
Mullany nails the essential nature of the Hype Cycle:
I think of the Gartner Hype Cycle as a Hero’s Journey for technologies. And just like the hero’s journey, the Hype Cycle is a compelling narrative structure.
… I’ve come to believe that the median technology doesn’t obey the Hype Cycle. We only think it does because when we recollect how technologies emerge, we’re subject to cognitive biases that distort our recollection of the past:
• Hindsight bias: we unconsciously “improve” our memory of past predictions.
• Survivor bias: it’s much easier to remember the technologies that succeed (we’re surrounded by them) rather than the technologies that fail.
Stories are fiction
The Hype Cycle is a compelling story — but that’s not the same as “empirically reliable.”
Gartner still publish updated reports on the Hype Cycle, most recently “Understanding Gartner’s Hype Cycles” in late 2018. This version admits that, maybe, the Hype Cycle might not work out — that failure is possible:
Obsolete before plateau (that is, the innovation will never reach the plateau, as it will fail in the market or be overtaken by competing solutions)
Even then, they shy away from the case of technologies that are almost entirely hype, saturated with scammers and fraud, and where the success stories don’t check out at all on closer examination — and which haven’t shown any prospects of real-world utility in ten years of hype.
Stop telling people that your failure just logically has to be followed by success. That’s not how it works. That’s not how anything works.
Can anything be recovered from the Hype Cycle model?
Colin Platt gave me this improved version of Gartner’s 2019 blockchain Hype Cycle, which completely explains PTK — always invoke the Hype Cycle.
Your subscriptions keep this site going. Sign up today!


I assume this was a call-back to a comment in your recent debate. I noticed the same thing, too. Medical cranks like to use the same thing, only there it’s often the Gallileo Gambit – say that Gallileo was also mocked as being unscientific and he was (inevitably?) vindicated. Therefore everyone who gets mocked must be like Gallileo, I assume. But pretty clearly there are other reasons to dismiss ideas. For instance, the idea is a bad one 🙂
There also seems to be a ton of survivor bias, where they take a few very successful companies and look back and see that they had troubles or detractors (or whatever) and conclude that either troubles _caused_ their success, or that detractors must somehow necessitate success.
You’d have to look at all ideas/companies/products that are hyped (or mocked or whatever) and then see how many of them went on to become successful. Without knowing anything else, let’s assume that their chances are just the industry average. Which is to say, almost certain failure 🙂
This one’s actually been in note form for a week or two – ever since Colin did the final version of that graph 😉
“…they also laughed at Bozo the Clown.”
After Gartner’s decade-long arse-lick of Microsoft I’m vaguely surprised they’re still in business, but I suppose there’s no shortage of idiots who want to pay to be told what to think.
I mean, given where Microsoft is, being their remora isn’t the worst place to be from a purely business perspective…
Where’s the axis for “actual effectiveness”?
The blue line in Fosdick’s graph. Not to be found in Gartner’s.
Yeah. The idea that “expectations” is a meaningful metric is kinda laughable just on its own… 🙂
The most interesting thing to me about looking at Gartner’s graph in this context is that it’s basically just the top “surface” of the Fosdick graph, meaning that past the bottom of the “trough of disillusionment”, it suddenly is tracking a *completely different thing* than it was before that point. In fact the nature of the switch rather resembles statistical “p-hacking” in that it goes from a mass of preliminary data points to tracking what we already know are successful outcomes.
Yes, that’s exactly what it does. The 2018 report I linked tries to explain this one away, but I’m pretty sure they’re talking about Y axes that aren’t in the same dimensions, let alone units.